Online Graph Maker Tool to Save as Image
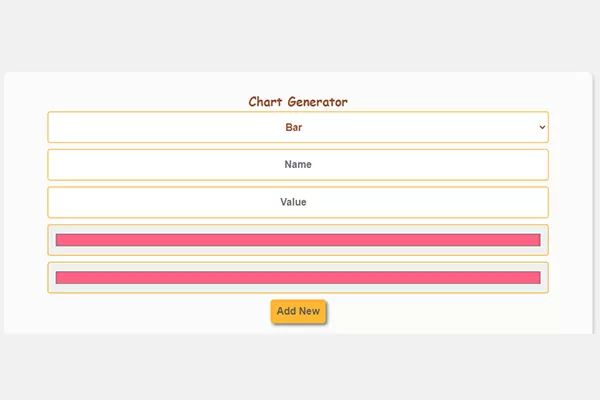
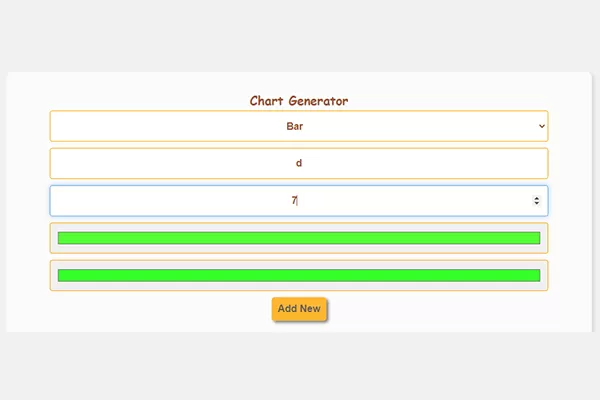
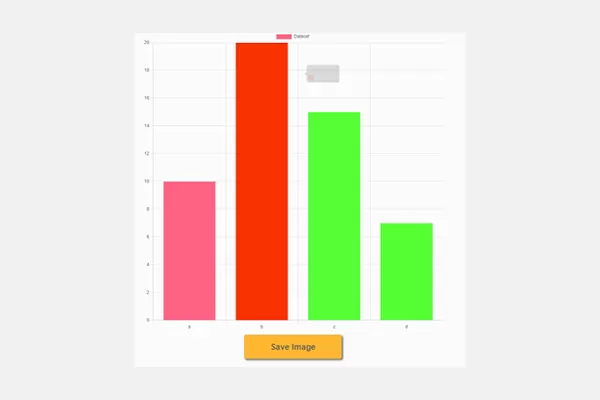
Free online graph generator tool with various forms and templates, turn your data into images in minutes.
ExplanationTurn your data into visual stories with a single click! With our free online graph generation tool.
Struggling with complex data? Looking for an easy and effective way to display your information? Our graph creation tool is the perfect solution! With an intuitive user interface and ready-made templates, you can turn any dataset into attractive graphs in minutes, no design skills required.
Tired of boring and traditional graphs? Our graph creation tool offers a wide variety of types and designs to choose from. Whether you need a pie chart, line graph, or heatmap, you'll find everything you need here. Design professional graphs for any presentation or report.
Benefits of the Graph Generation Tool
Want to improve your business performance? Our graph maker tool helps you analyze data and make informed decisions. Create interactive dashboards to track performance, identify trends, and discover new opportunities. Imagine turning complex spreadsheets into attractive graphs in just a few minutes. With our graph generation tool, this is possible! Whether you're a student, researcher, or business owner, our tool helps you:
* Easily understand data: Simplify complex information and make it more understandable.
* Make better decisions: Discover hidden patterns and trends in your data.
* Create impactful presentations: Add a professional touch to your presentations with high-quality graphs.
* Enhance collaboration: Share your graphs easily with your team.
Don't miss the chance to turn your data into impactful stories! Try our graph creation tool for free now!
Benefits of the Graph Generation Tool
* Easily understand data: Simplify complex information and make it more understandable.
* Make better decisions: Discover hidden patterns and trends in your data.
* Create impactful presentations: Add a professional touch to your presentations with high-quality graphs.
* Enhance collaboration: Share your graphs easily with your team.


Graphs: The Language of Numbers Everyone Speaks
What Are Graphs?
Graphs are visual representations of numerical data. They turn complex numbers into easy-to-understand images, helping us discover patterns and trends, compare values, and make informed decisions.
Why Do We Use Graphs?
* Simplification: Graphs make complex data easy to understand, even for those without statistical expertise.
* Comparison: Graphs allow us to easily compare different datasets, helping us identify relationships and differences.
* Analysis: Graphs help us uncover patterns and trends in the data, enabling us to predict future outcomes and make better decisions.
* Communication: We can use graphs to effectively convey information to a wide audience, whether colleagues, clients, or investors.
Types of Graphs
There are many types of graphs, each suited for specific uses:
* Pie Charts: Used to compare parts of a whole.
* Bar Charts: Used to compare values across different categories.
* Line Charts: Used to show changes in data over time.
* Scatter Plots: Used to show the relationship between two variables.
* Heatmaps: Used to show dense data in color format.
* Treemaps: Used to display hierarchical structures.
The Importance of Graphs in Today's World
Graphs are an integral part of our daily lives. We see them in newspapers, magazines, presentations, websites, and even on our smartphones. Graphs play a vital role in many fields, including:
* Business: Companies use graphs to analyze financial data, track sales performance, and make investment decisions.
* Science: Scientists use graphs to present research findings and interpret experimental data.
* Politics: Governments use graphs to present economic and social statistics, and explain public policies.
* Marketing: Businesses use graphs to showcase marketing campaign results and assess the effectiveness of strategies.
How to Choose the Right Graph
Choosing the right type of graph depends on the data you want to present and the objective you aim to achieve. The graph should be clear, simple, and easy to understand.
Tips for Creating Effective Graphs
* Choose appropriate colors: The colors should be consistent and attractive, helping to distinguish the data.
* Use titles and captions: Titles and captions should be clear and concise.
* Choose the right size: The graph should be large enough to be easily readable, but not too large to take up too much space.
* Avoid overloading with information: Do not try to display too much data in one graph.
Quote" Graphs are a powerful tool that helps us understand, analyze, and interpret data. By using graphs correctly, we can make better decisions and solve complex problems. "– Plattru


